
Understand the match.
Then research the bet.
You don’t need to use every tool at once. Start with the projections, find a matchup that interests you, then use the other pages to understand the numbers behind it.
How I use DataGaffer: I open Projections first. Pace Score is my favorite tool for finding open, attacking games, and I use Style Grades to explore how the two teams’ playstyles match up.
Don’t stop at Top Edges. It’s only a small part of DataGaffer, not the whole research process. A potential value selection is a starting point, not an instruction to place a bet.
Screenshots are examples, not current picks or prices. Tap any image to enlarge it. Available data and markets vary by match.
1. Start with Projections
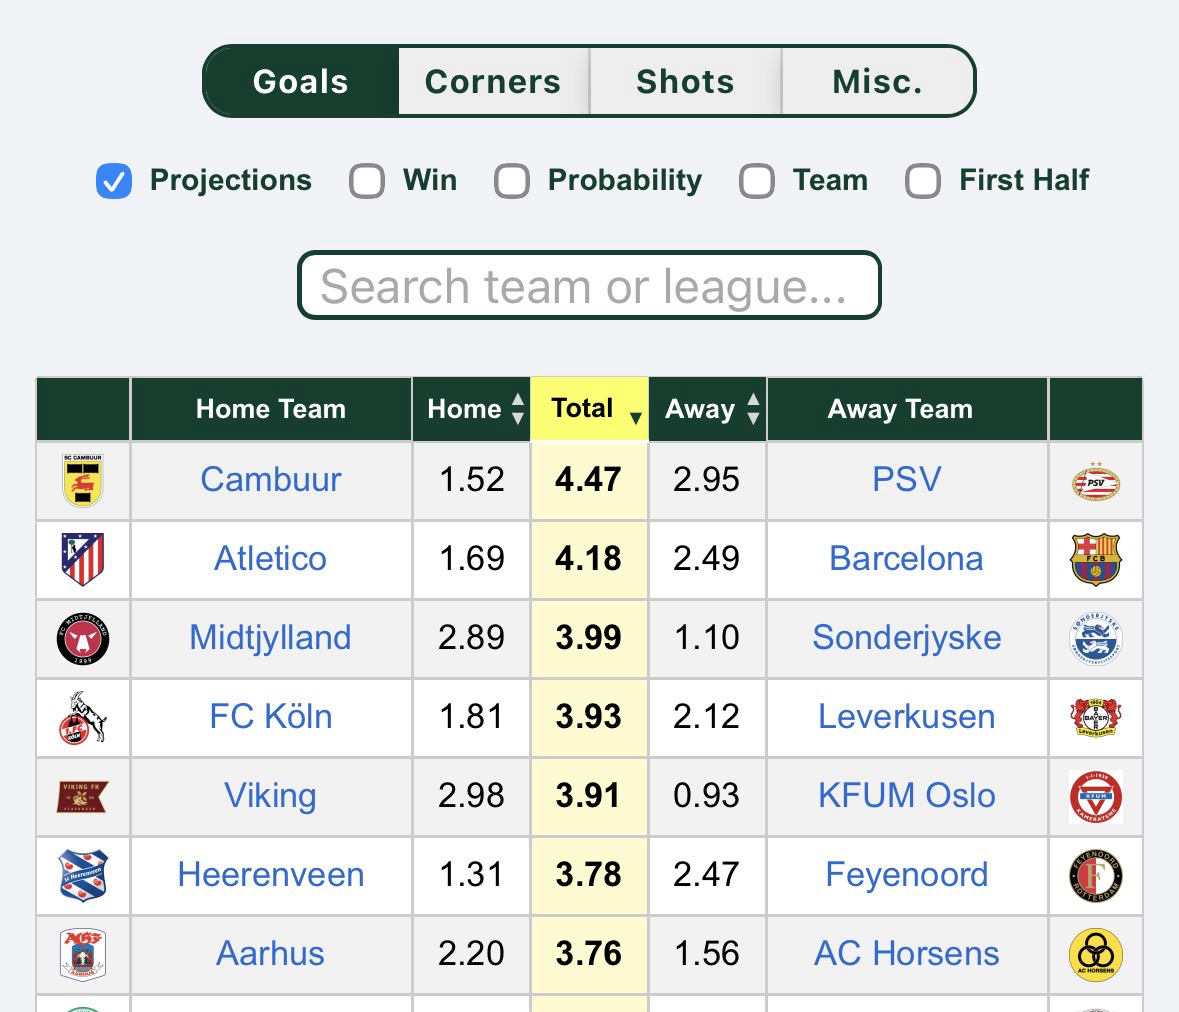
From the dashboard’s Match Simulations section, open Projections. This is my first stop for goals, corners, shots, shots on target and miscellaneous projected stats, plus probabilities such as wins and BTTS.
- Select the category: Goals, Corners, Shots or Misc.
- Use the options beneath it to choose the view you want. Search for a team or league to narrow the slate.
- Sort a relevant column to find higher or lower projections. Look at both teams, not just the combined total.
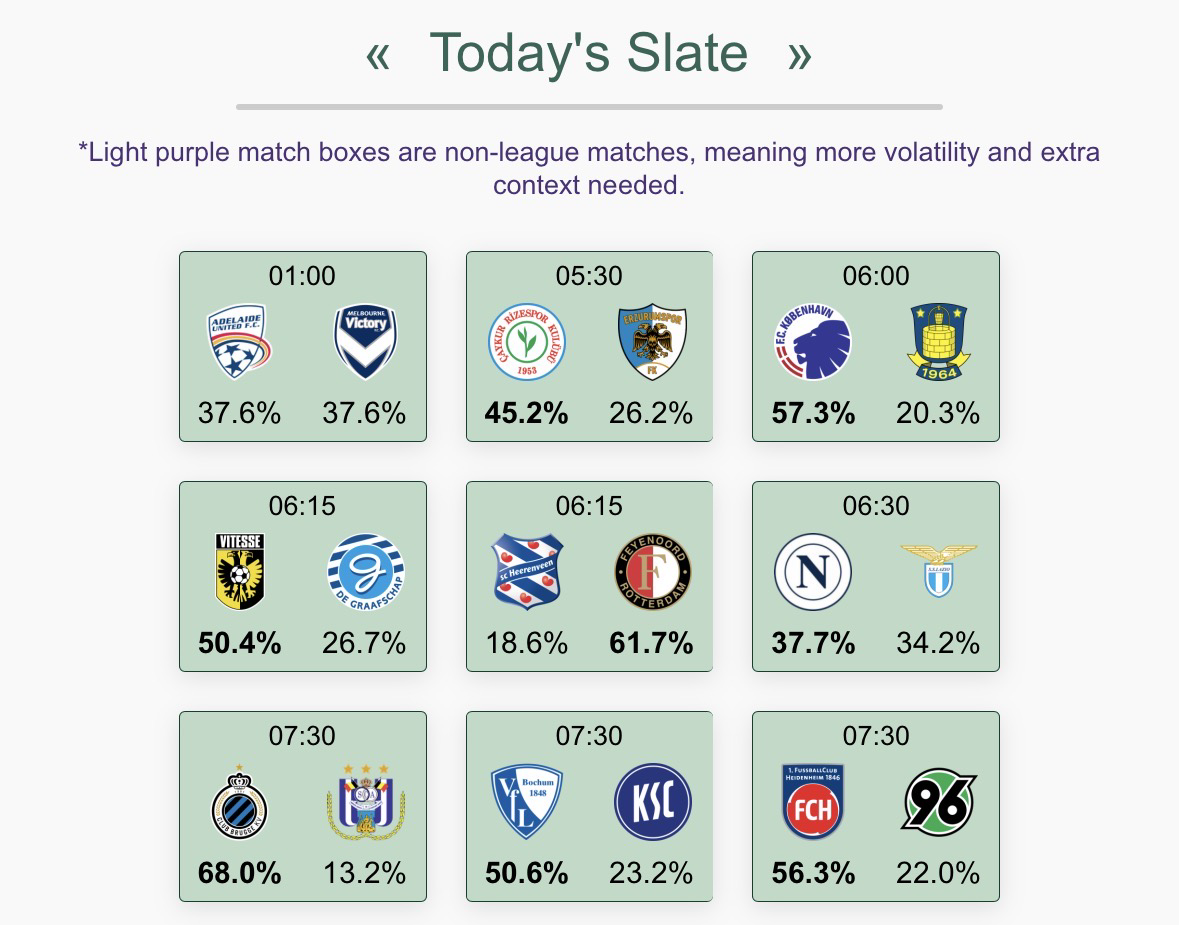
Already have a specific match in mind?
Open its match box under Today’s Slate on the dashboard. The match page brings the research together: Projections for simulated stats and probabilities, Insights for team context, and Player for player projections and recent stats.
2. What do you want to research?
Use these as routes through the site, not automatic betting rules.
Where do I find unders?
Start with the under probabilities in Value Finder and the totals in Projections. A low Pace Score can provide context, but it does not automatically mean an under is a good bet. Check the specific line and price; a one-sided game can still produce plenty of goals.
Corners
I start with corner projections, then look at the corner grades and supporting data in Style Grades. Make sure you distinguish a match total from one team’s total before comparing it with a bookmaker’s line.
Shots & SOT
Start with the Shots section in Projections. For high-SOT matchups, I also use Matchup Scores → Pace → SOT. Check how the total is split between the teams, especially when researching a team-specific market.
Teams to win
Use the win probabilities in Projections, then explore Venue Score in Matchup Scores for another view of the matchup. A likely winner is not necessarily good value at the available odds.
3. Find open, attacking games
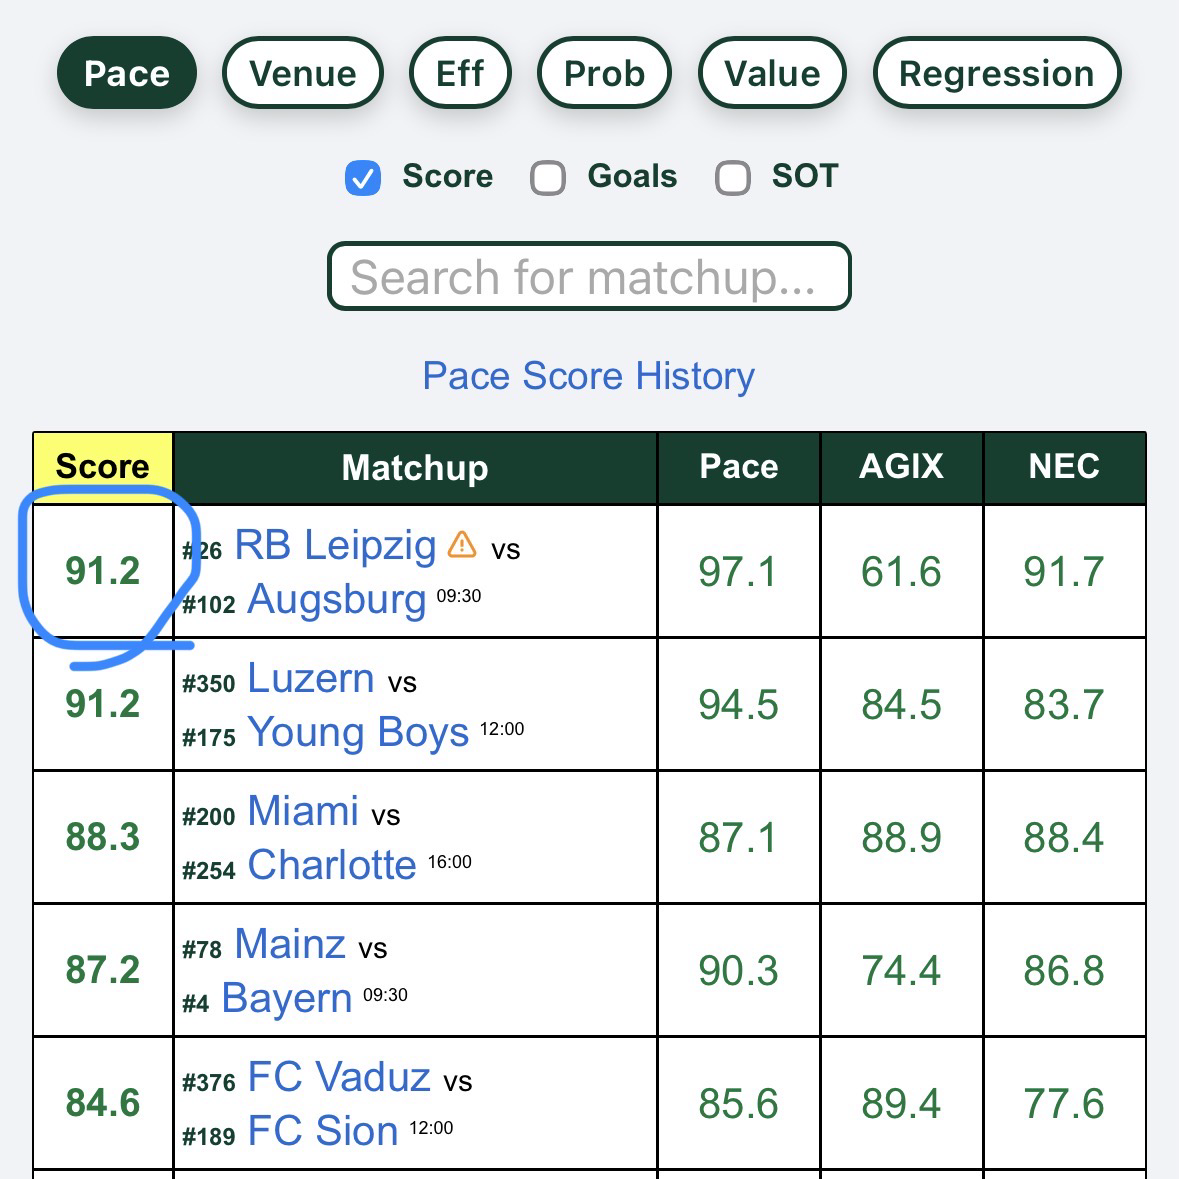
Pace Score is my favorite tool on DataGaffer. It’s where I go when I want to find a promising goal environment or simply an exciting, open game to watch.
Open Matchup Scores → Pace and sort the Score column. Use it to shortlist matches, then return to the projections for the specific market you’re researching.
Then check how the styles match up
In Style Grades, look at the relevant Goals, BTTS, Corners, SOT, Shots or Pace grade, then examine the supporting trends. The question is: how have matches against these types of playstyles tended to play out?
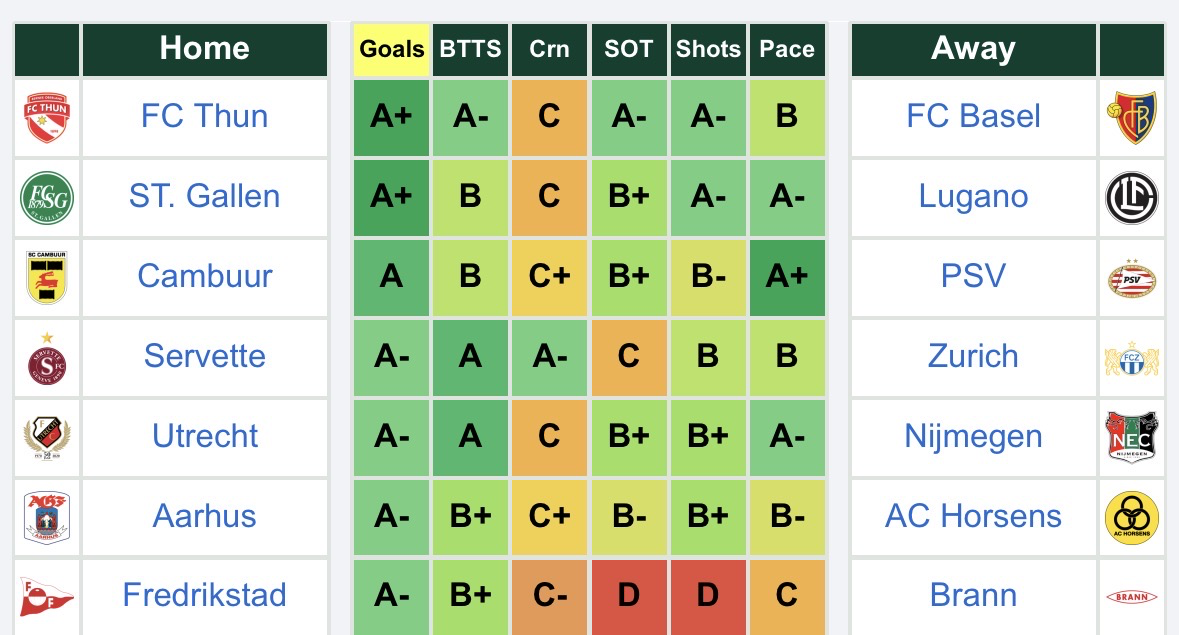
For BTTS specifically, check each team’s scoring outlook. A high match total can come mainly from one team. Also look for evidence against your initial pick. These tools share some inputs, so agreement is not several independent guarantees.
4. Research when goals might arrive
Match Dynamics helps you think about how a match might play out, not just which bet to place. It includes Minute Timeline, goal distribution, pressure control, shot quality, shot location and first-to-score information.
For first-half research, I like Minute Timeline alongside the AGIX Index. When researching live goal overs, I also look at the second-half or 75–90-minute columns as background context.
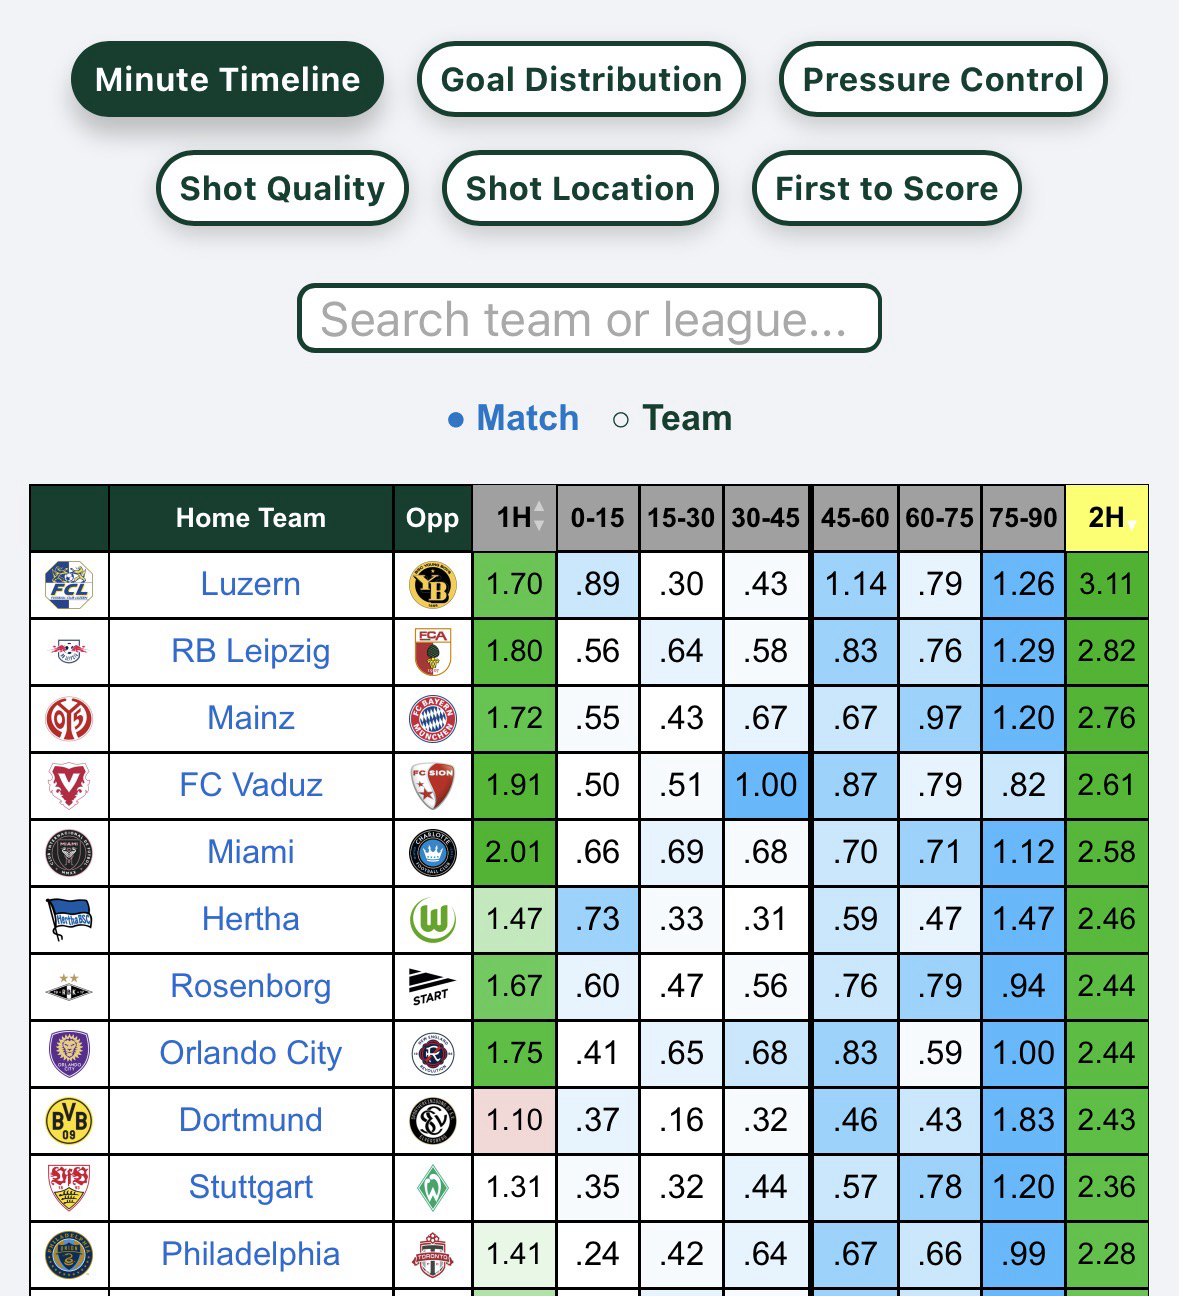
For live betting: treat the pre-match timeline as background, not a live prediction updated for the score, red cards, substitutions or time remaining. Check the actual game state and current odds separately.
Projected big chances, box shots and possession can also help you understand the expected shape of the game. No single stat tells the whole story.
5. Research player bets
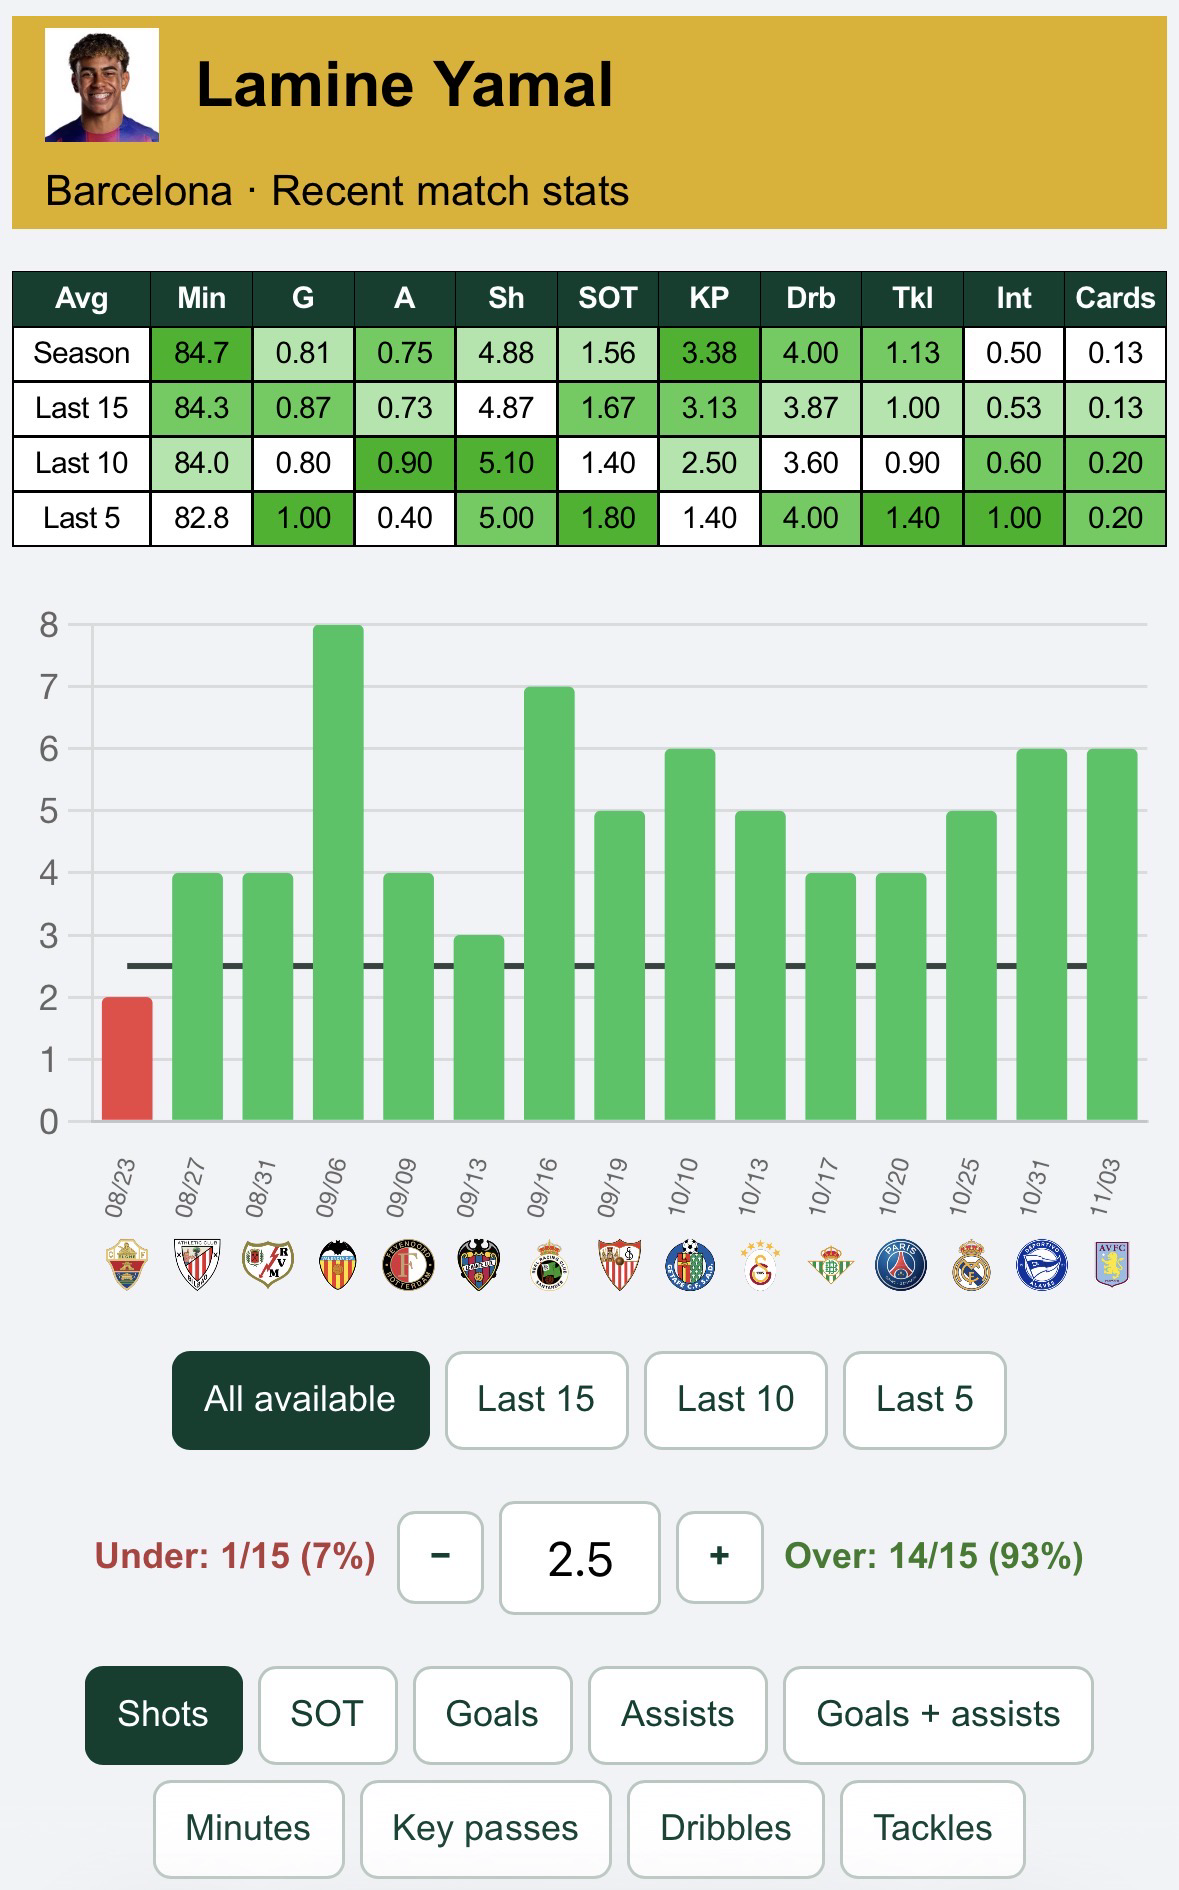
My starting point is Player Simulations. Find the player and market that interest you, then click the player’s name to open their detailed player card.
- Compare the Season, Last 15, Last 10 and Last 5 averages.
- Check minutes alongside the stat. A player’s opportunity can change with their role and expected playing time.
- Choose a stat and match window, then adjust the line to explore the recorded results.
- Check lineup news and the actual bookmaker’s line before drawing conclusions.
6. Understand ratings, indexes & recent form
The DG Ratings and DG Indexes are central to how I research football and build DataGaffer’s projections. Ratings help compare team strength; indexes help describe playing style and other team characteristics.
I like comparing raw home and away ratings for same-league matchups. They use the statistical profiles without league-strength adjustment, so I don’t use them as a like-for-like comparison across different leagues.
Are teams hot, cold or “due”?
Use xG Performance to examine recent results against underlying chance creation, alongside efficiency ratings. This can help you question whether a run is supported by performance or driven by unusually strong or weak finishing.
“Due” does not mean a team must score next time. Underperformance can persist, and injuries, player quality and tactical changes matter. Treat possible regression as a question to investigate, not a guarantee.
7. Compare the projection with the price
Value Finder is where to explore the available market categories and lines. Select a market, compare the simulated probability with the saved bookmaker odds, and switch between Edge and +EV.
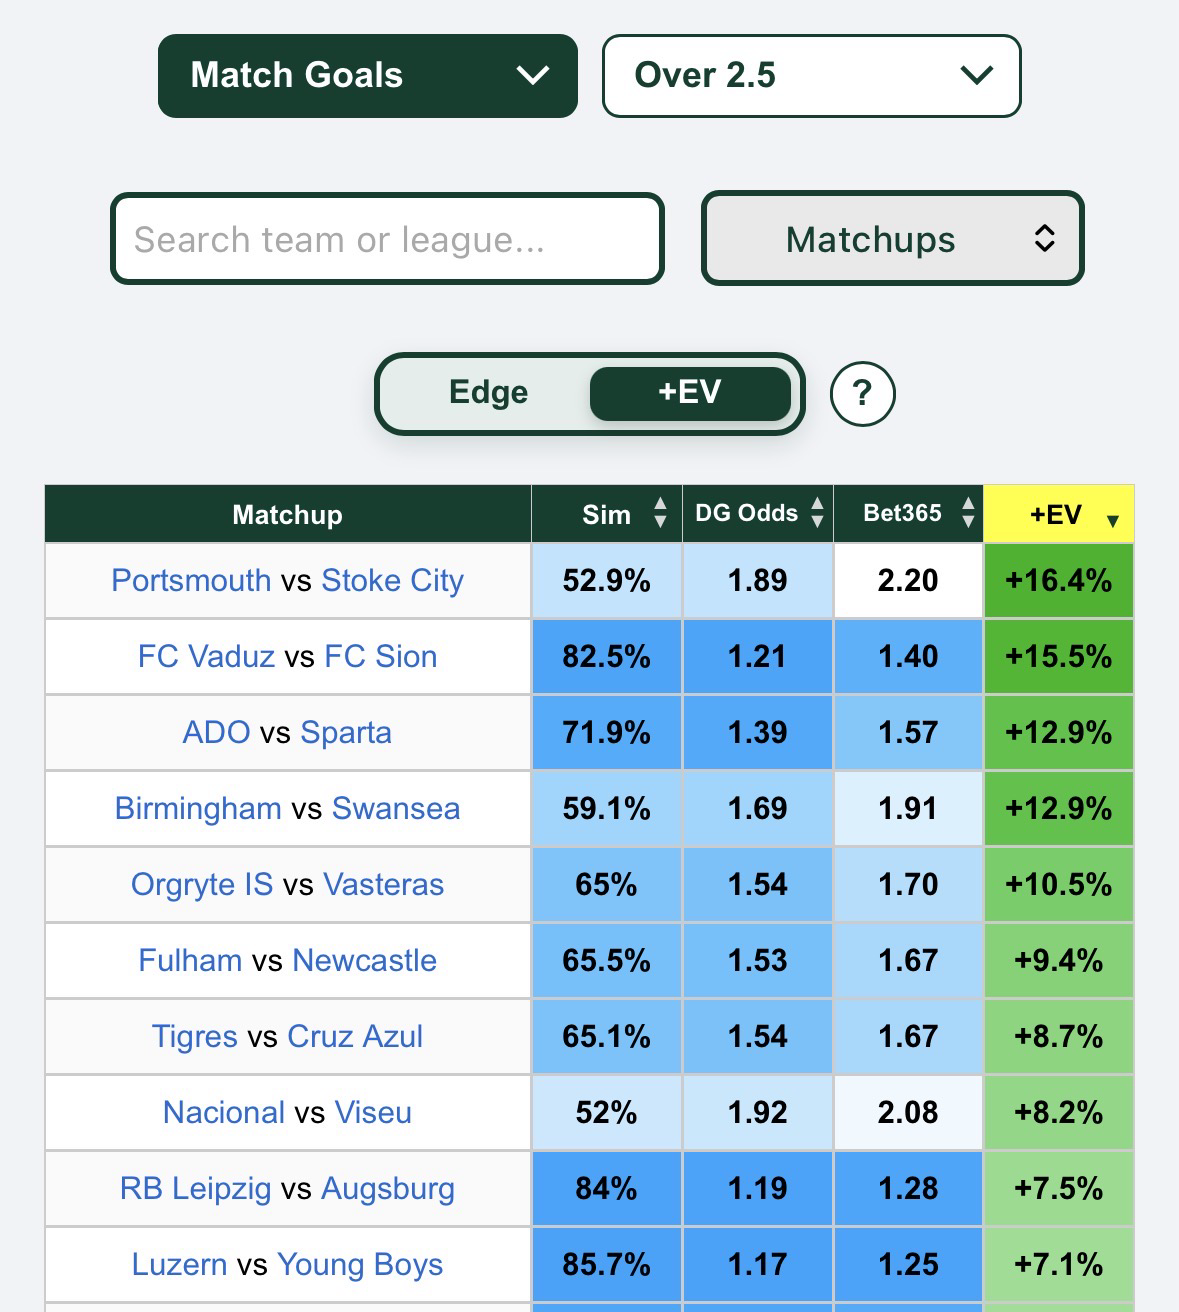
- Sim %
- The model’s estimated probability, not a certainty.
- DG Odds
- The model’s implied fair price for the market.
- Edge (pp)
- The difference between model probability and the probability implied by the bookmaker’s odds, expressed in percentage points.
- +EV
- Estimated expected return at the listed odds, assuming the model probability is accurate. It is not a promised profit or a confidence score.
For a simple win-or-lose market, a 60% model probability at 2.00 odds gives a 10 pp edge and +20% EV. Markets with pushes or partial settlements need their settlement rules included.
Top Edges highlights potential value selections, while Elite Edges qualify under additional filters. Neither replaces matchup research. Passing on a match is always an option.
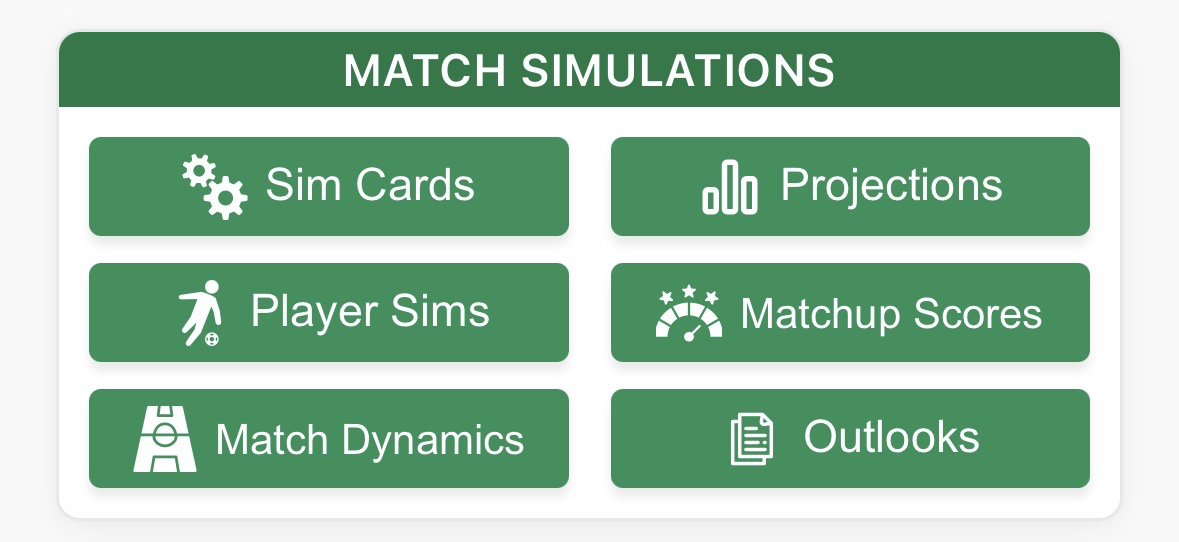
8. What does each dashboard button do?
Use this reference whenever you’re unsure where to go. Expand a section to see its tools.
Match Simulations
- Sim Cards
- Browse the slate in a simulation-card format.
- Projections
- The starting point for simulated match and team stats and probabilities.
- Player Sims
- Explore player projections; click a player for their detailed stats.
- Matchup Scores
- Compare matches through Pace, Venue, Efficiency, Probability, Value and Regression views.
- Match Dynamics
- Explore timing, pressure, possession, shot quality and how a match might unfold.
- Outlooks
- A collection of slate-wide summaries and outlooks, including the daily cheat sheet.
Match Insights & Betting Tools
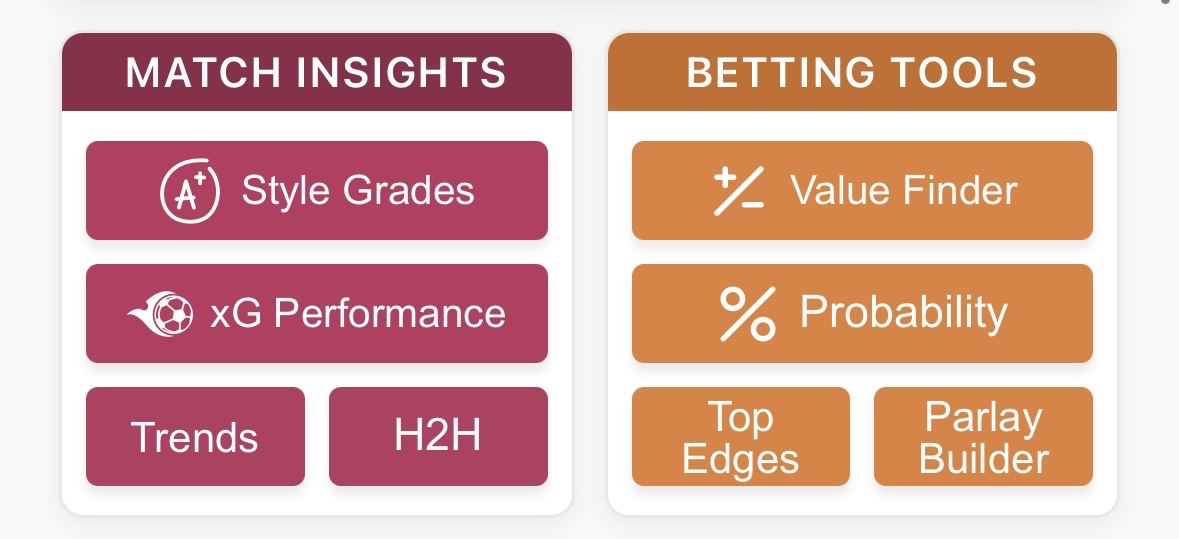
- Style Grades
- Grades and historical trends for how different playstyles match up.
- xG Performance
- Explore expected goals, recent performance and over- or underperformance.
- Trends
- Explore team trends as supporting context, checking the sample behind them.
- H2H
- Research previous meetings. Older results may involve different squads or managers.
- Value Finder
- Browse supported markets and compare model probabilities with saved bookmaker prices.
- Probability
- Browse match, team and player probabilities for selected outcomes.
- Top Edges
- Potential value selections, including those that meet Elite Edge criteria.
- Parlay Builder
- Explore combinations of selections. Adding legs increases the ways a bet can lose; related outcomes are not necessarily independent.
DataGaffer Ratings
Research

Bottom links & exports
- What are DG Ratings & Indexes?
- Read the definitions behind the ratings and indexes.
- About
- Learn about DataGaffer and the platform.
- Accuracy
- Review the available projection tracking.
- Contact
- Ask a question or send feedback.
- Export
- Use the dashboard’s Export menu to download available sheets as images.
9. A few things to remember
Is DataGaffer still in public beta?
Yes. I’m testing improvements behind the scenes across projections, Pace Score, Elite Edges and other parts of the site. Machine-learning experiments cover several areas, not just betting selections.
It’s an exciting stage of the project. My goal is the first full release next season, with decisions informed by the results of this testing. That is a target, not a promise that every experiment will improve performance or that development will stop.
Does a high score or green cell mean I should bet?
No. Scores, grades, probabilities and historical hit rates mean different things. Read the column label, consider the sample and matchup, and compare the actual odds. High probability and good value are not the same thing.
Why do the bookmaker’s odds differ from the site?
Odds can move after the slate is updated. The edge and EV shown relate to the saved price, not automatically to the price available now.
Do I need to use every page?
No. Start with Projections and the match card. Add the tools that answer your specific question. For goals, my usual next stops are Pace Score and Style Grades.
DataGaffer provides research and estimates, not guaranteed outcomes. Use a budget you can afford to lose, and never chase losses.